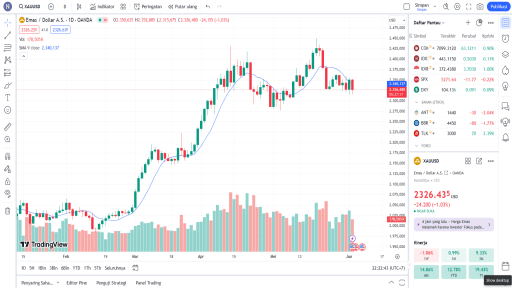
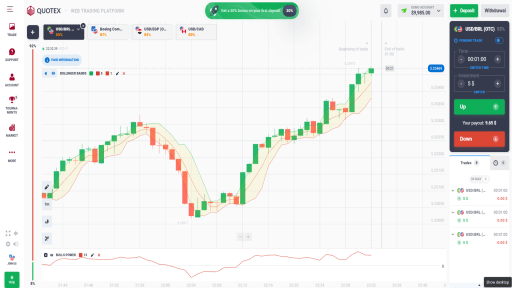
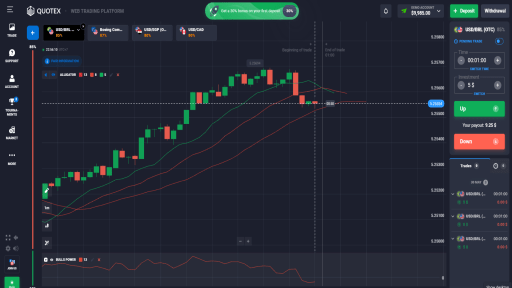
The Simple Moving Average (SMA) indicator is a fundamental tool in the world of trading. It helps traders identify trends and make informed decisions based on historical price data. But what exactly is an SMA, and why should it be your new best friend in trading?
Understanding the Simple Moving Average
The SMA is a calculation that takes the average of a selected range of prices, usually closing prices, over a specified period. For instance, a 20-day SMA will average the closing prices of the past 20 days. This smooths out price fluctuations and provides a clearer picture of the market trend.
Why Use the SMA Indicator?
The SMA indicator is popular among traders for several reasons. Firstly, it’s straightforward and easy to use. Even beginners can quickly grasp how to apply it to their trading strategies. Secondly, it helps in identifying trends, which are crucial in making trading decisions. By comparing short-term and long-term SMAs, traders can spot potential buy or sell signals.
Implementing SMA in Your Trading Strategy
To effectively use the SMA indicator, you need to understand how to interpret its signals. When the short-term SMA crosses above the long-term SMA, it may indicate a buying opportunity. Conversely, when the short-term SMA crosses below the long-term SMA, it could signal a selling opportunity. Combining SMA with other indicators can also enhance its effectiveness.
Conclusion
In conclusion, the SMA indicator is a valuable tool for any trader’s toolkit. Its simplicity and effectiveness in identifying trends make it an essential component of a successful trading strategy. By integrating the SMA into your trading approach, you can make more informed decisions and improve your trading outcomes.


