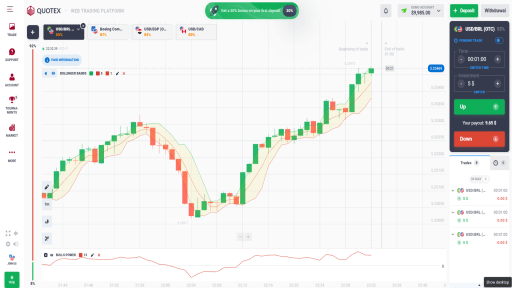
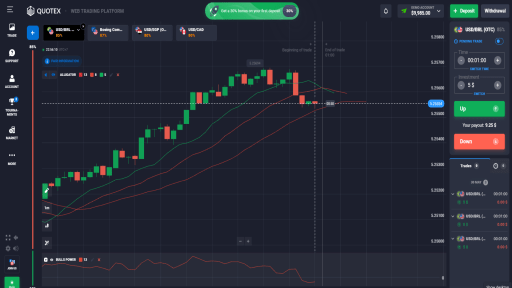
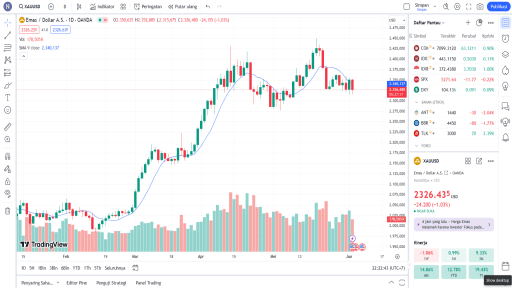
Bollinger Bands are a popular technical analysis tool used by traders to understand market volatility and make informed trading decisions. Created by John Bollinger in the 1980s, Bollinger Bands consist of three main components: a moving average, an upper band, and a lower band. The moving average, typically a 20-day simple moving average (SMA), serves as the central line. The upper and lower bands are calculated by adding and subtracting a standard deviation from the moving average, respectively. These bands expand and contract based on market volatility, providing traders with visual cues about price movements and potential trading opportunities.
The significance of the moving average in Bollinger Bands lies in its ability to smooth out price data, offering a clearer picture of the underlying trend. The upper and lower bands, on the other hand, serve as dynamic support and resistance levels. When the price approaches or touches these bands, it often signals that the market is either overbought or oversold, prompting traders to consider potential reversal or continuation patterns.
Bollinger Bands are widely used across different types of markets, including stocks, commodities, and forex. Their versatility and adaptability make them a valuable tool for both novice and experienced traders. By observing the interaction between price and the bands, traders can identify periods of high and low volatility, set entry and exit points, and manage risk more effectively. Bollinger Bands also complement other technical indicators, enhancing the overall robustness of trading strategies.
In summary, Bollinger Bands offer a comprehensive framework for analyzing market conditions. Their ability to adapt to changing volatility levels and provide clear visual signals makes them an indispensable tool in the trader’s toolkit. Whether used alone or in conjunction with other indicators, Bollinger Bands continue to be a reliable method for navigating the complexities of financial markets.
Setting Up Bollinger Bands in Your Trading Platform
Bollinger Bands are a versatile and widely-used technical analysis tool that helps traders identify potential buy and sell signals based on market volatility. Setting up Bollinger Bands on your trading platform can enhance your trading strategy, and this guide will walk you through the process for popular platforms like MetaTrader 4/5, Thinkorswim, and TradingView.
MetaTrader 4/5
To add Bollinger Bands in MetaTrader 4/5, follow these steps:
- Open your MetaTrader platform and select the chart where you want to add Bollinger Bands.
- Click on the “Insert” menu, then navigate to “Indicators,” followed by “Trend” and select “Bollinger Bands.”
- A dialog box will appear where you can set the parameters. The standard settings are a period of 20 and a deviation of 2. You can customize these settings based on your trading strategy.
- Click “OK” to apply the Bollinger Bands to your chart.
Thinkorswim
For Thinkorswim users, adding Bollinger Bands is straightforward:
- Open Thinkorswim and navigate to the chart where you want to add Bollinger Bands.
- Click on the “Studies” button located at the top of the chart, then select “Add study” and navigate to “All Studies” and choose “Bollinger Bands.”
- You can adjust the settings in the dialog box that appears. The default settings are typically a period of 20 and a standard deviation of 2. Modify these parameters if needed.
- Click “Apply” to see the Bollinger Bands on your chart.
TradingView
Here’s how you can set up Bollinger Bands on TradingView:
- Open TradingView and select the chart you want to analyze.
- Click on the “Indicators” button at the top of the chart.
- In the search bar, type “Bollinger Bands” and select it from the list of indicators.
- The default settings will be applied, with a period of 20 and a standard deviation of 2. To customize, click on the settings icon next to the indicator name.
- Adjust the parameters as per your trading strategy and click “OK.”
Customizing Bollinger Bands
While the standard settings for Bollinger Bands are a period of 20 and a standard deviation of 2, traders often customize these settings to better align with their trading strategies. For instance, a shorter period might be more suitable for short-term trading, while a longer period could benefit long-term strategies. Adjusting the standard deviation helps in capturing different levels of market volatility.
Importance of Backtesting
Backtesting is crucial for refining your Bollinger Bands setup. By using historical data, traders can evaluate how well their customized Bollinger Bands would have performed in past market conditions. Most trading platforms offer backtesting features, allowing you to simulate trades and analyze the outcomes. This step is essential for gaining confidence in your strategy before applying it in live markets.
Trading Strategies Using Bollinger Bands
When it comes to mastering the art of trading with Bollinger Bands, several effective strategies can be employed to capitalize on market movements. One such strategy is the Bollinger Band Squeeze. This strategy is based on the principle that periods of low volatility are often followed by periods of high volatility. During a squeeze, the bands come close together, indicating a potential breakout. Traders can look for a breakout above the upper band or below the lower band to enter a trade. The advantage of the Bollinger Band Squeeze is its ability to identify potential breakout points, but its limitation lies in the possibility of false breakouts.

Another popular strategy is the Bollinger Band Breakout. This strategy focuses on trading the trend when the price breaks out of the upper or lower band. For example, a breakout above the upper band signals a potential uptrend, prompting traders to go long. Conversely, a breakout below the lower band signals a potential downtrend, leading traders to go short. The Bollinger Band Breakout strategy is advantageous for capturing strong trends but can be less effective in ranging markets where the price oscillates within a narrow band.
The Mean Reversion strategy
The Mean Reversion strategy is another technique used with Bollinger Bands. This strategy is predicated on the idea that prices tend to revert to their mean or average over time. When the price touches or breaches the upper band, it is considered overbought, and traders may look to sell. Conversely, when the price touches or breaches the lower band, it is considered oversold, and traders may look to buy. While mean reversion can be effective in range-bound markets, it may not perform well in strong trending markets.
Combining Bollinger Bands with other technical indicators can enhance trading decisions. For instance, incorporating the Relative Strength Index (RSI) can help confirm overbought or oversold conditions, adding another layer of validation to trades. Additionally, using moving averages can help identify the overall trend direction, providing context for Bollinger Band signals.
Effective risk management is crucial when trading with Bollinger Bands. Setting stop-loss orders is essential to minimize potential losses. For instance, placing a stop-loss order just outside the Bollinger Bands can help protect against adverse price movements. Traders should also consider position sizing and risk-reward ratios to ensure their trades align with their overall risk tolerance and trading plan.
Common Mistakes and Best Practices
When using Bollinger Bands, many traders fall into the trap of relying solely on this technical indicator for their trading decisions. One of the most common mistakes is neglecting to incorporate other forms of analysis, such as fundamental analysis and market sentiment. Bollinger Bands are indeed powerful, but they are most effective when complemented by a comprehensive trading strategy that includes multiple analytical approaches.
Another frequent mistake is misinterpreting the signals generated by Bollinger Bands. For example, traders often assume that a price touching the upper band is an automatic sell signal, or conversely, that touching the lower band is a buy signal. However, these touches can also indicate a continuation of the current trend rather than a reversal. It is crucial to consider the broader market context and use additional indicators to confirm the signals provided by Bollinger Bands.
Best practices for using Bollinger Bands effectively involve a few key strategies. First, monitoring market conditions is essential. Different market environments, such as trending or ranging markets, can significantly impact the performance of Bollinger Bands. Adjusting the settings of the bands based on market volatility can also enhance their effectiveness. For instance, during periods of high volatility, widening the bands can help in capturing more significant price movements, while in low volatility environments, narrowing the bands might be more suitable.
Continuous education on technical analysis is another critical aspect. The financial markets are ever-evolving, and staying updated with the latest analytical techniques and tools will help in making informed trading decisions. Engaging with the trading community, participating in webinars, and reading relevant literature can provide valuable insights.
Experienced traders often emphasize the importance of a disciplined approach to using Bollinger Bands. They recommend maintaining a trading journal to document trades and reflect on what strategies worked and what didn’t. This practice can help in fine-tuning one’s approach and mastering the use of Bollinger Bands over time.


